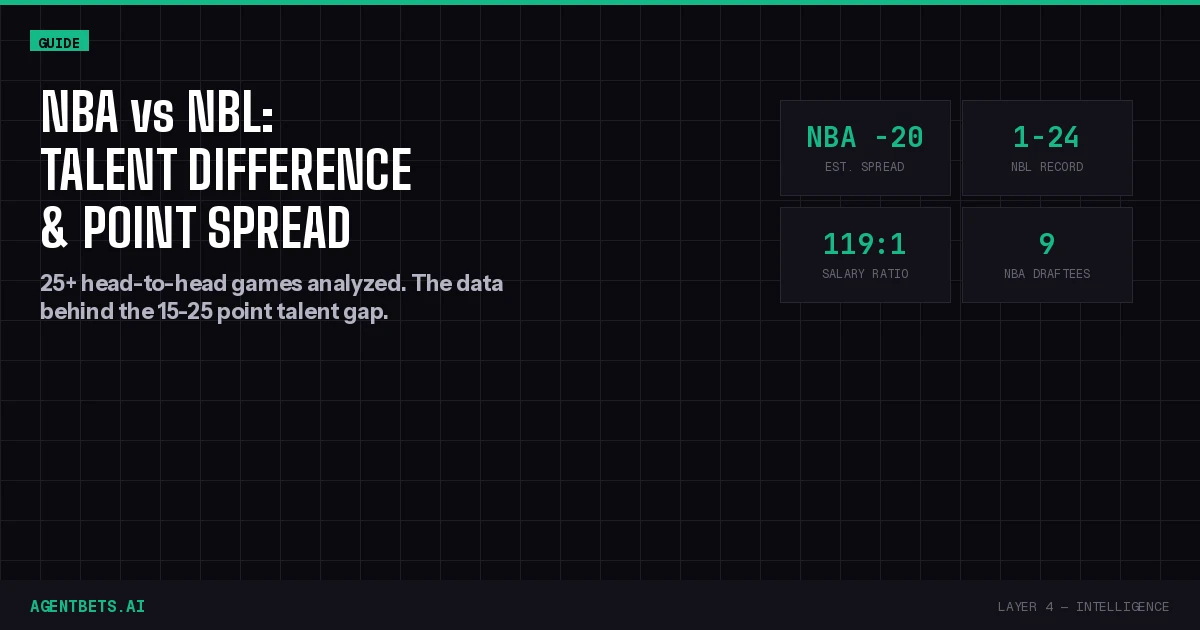
Based on 25+ NBLxNBA head-to-head exhibition games, the realistic point spread between an NBA team and an NBL team is 15-25 points, with the actual margin swinging on starters’ minutes, game intensity, and the 8-minute game-length difference. The NBL’s lone win — Adelaide 36ers 134, Phoenix Suns 124 in 2022 — required a historic 55.8% three-point shooting night. The salary gap between the leagues is approximately 100:1.
Part of the NBA vs NBL Betting Guide — this article covers the talent gap and point spread. For sportsbooks, bet types, odds, and strategy, see the full guide.
The Short Answer: 15-25 Points
If you wanted to set a line on a full-effort NBA team vs. the best NBL team, you’d be looking at NBA -20 as the market-clearing number. But “full effort” is doing a lot of work in that sentence — these games only happen during NBA preseason, which means load management, minute restrictions, and experimental lineups.
Here’s how the spread shifts based on context:
| Scenario | Estimated Spread | Why |
|---|---|---|
| NBA starters play 30+ min, regular season intensity | NBA -25 to -35 | Full talent and systems gap exposed |
| NBA starters play 15-20 min (typical preseason) | NBA -15 to -20 | Reduced minutes limit scoring runs |
| NBA rests most starters, deep bench only | NBA -5 to -12 | End-of-bench NBA players ≈ NBL import quality |
| NBL team has a historic shooting night | Push to NBL +10 | The Adelaide 36ers scenario |
The 2025 Melbourne Series provided the freshest data point: the New Orleans Pelicans — a team that finished the 2024-25 NBA season with a losing record — beat Melbourne United by 10 and South East Melbourne Phoenix by 35. The spread moved from -20 (Game 1) to -25 (Game 2) after oddsmakers saw how Game 1 played out.
Every NBLxNBA Result: The Complete Record
The NBLxNBA series has run since 2017, producing the only meaningful head-to-head dataset between the two leagues. Here’s the full picture:
2017 Series (NBL 0-3)
Three NBL teams — Brisbane Bullets, Melbourne United, and Sydney Kings — traveled to the United States for the inaugural series. All three lost, though one game came down to a single point. The series drew higher TV ratings than normal NBL games and was considered a success for exposing the league internationally.
2018 Series (NBL 0-7)
Five NBL teams played seven games in the U.S. The Adelaide 36ers came closest, reaching 99 points — at the time the highest score an NBL team had posted against NBA opposition. No victories, but competitive scorelines showed the gap wasn’t insurmountable on a good night.
2019 Series (NBL 0-5)
Adelaide, Melbourne United, and the New Zealand Breakers took on the Jazz, Grizzlies, Thunder, Clippers, and Kings. Melbourne United crossed the 100-point barrier in both their games (against the Clippers and Kings) — the first time an NBL team had done that against NBA competition. Still, all five games went to the NBA side.
2022 Series (NBL 1-1) — The Historic Win
The Adelaide 36ers returned to the U.S. and did what no NBL team had done before: won.
The 36ers shot 24-of-43 from three (55.8%) to beat the Phoenix Suns 134-124 on October 2, 2022, in Phoenix. This was no soft Suns lineup — Chris Paul, Devin Booker, and Deandre Ayton all played significant minutes. Phoenix had finished the prior regular season 64-18. Craig Randall II led Adelaide with 35 points, Robert Franks added 32.
The 36ers then lost to the Oklahoma City Thunder in their second game, bringing the series record back to reality.
2023 Series (NBL 0-4)
The Cairns Taipans and New Zealand Breakers played four games against Washington, Toronto, Portland, and Utah. All four went to the NBA side.
2024 Series (NBL 0-3)
The New Zealand Breakers played Utah, Oklahoma City, and Philadelphia. Three losses, three more data points confirming the structural talent gap.
2025 Melbourne Series (NBL 0-2)
The first NBA games ever played on Australian soil. The New Orleans Pelicans beat Melbourne United 107-97 (spread was -20, Pelicans didn’t cover) and demolished South East Melbourne Phoenix 127-92 (spread was -25, Pelicans covered by 10).
Zion Williamson played only 15 minutes in each game. Trey Murphy III led the Pelicans with 18 in Game 1. Saddiq Bey had 21 in Game 2.
Overall NBLxNBA record: NBA leads 24-1 (approx.), with Adelaide’s 2022 upset as the lone NBL win.
Why the Gap Exists: Follow the Money
The talent difference between the NBA and NBL isn’t mysterious — it’s almost entirely explained by economics.
Salary Cap Comparison (2025-26 Season)
| Metric | NBA | NBL | Ratio |
|---|---|---|---|
| Team salary cap | $154.6M USD | ~$1.3M USD | 119:1 |
| Minimum player salary | ~$1.15M USD | ~$52K USD | 22:1 |
| Top player salary | ~$55M USD | ~$650K USD | 85:1 |
| Total league spend (est.) | ~$4.6B USD | ~$13M USD | 354:1 |
The NBA salary cap for 2025-26 is $154.647 million per team. The NBL’s is approximately AU$2.03 million (roughly $1.3 million USD at current exchange rates). An NBA team’s minimum roster spend ($139.2 million) is more than 100 times an NBL team’s entire payroll.
This means the NBA’s worst player on a minimum contract earns more than the NBL’s best player on a marquee deal. The 15th man on an NBA roster makes roughly what an entire NBL starting five costs.
What the Salary Gap Means for Talent
The salary gap creates a one-way talent pipeline:
- Any NBL player good enough to earn an NBA roster spot will take the money and leave
- The NBL retains players who are either (a) not quite NBA-level, (b) at the end of their NBA careers and returning home (Matthew Dellavedova, Aron Baynes), or (c) young prospects passing through on short-term Next Stars deals
- NBA end-of-bench players (11th-15th man) are roughly equivalent to top NBL imports
- An average NBA starter would dominate the NBL as the best player in the league
This creates a structural ceiling on NBL talent that no amount of coaching or player development can overcome. The best NBL teams are, by design, losing their best players every year.
The NBL-to-NBA Pipeline: Next Stars and Beyond
Despite the talent gap, the NBL has carved out a unique role as the most productive non-college NBA pipeline in the world.
NBL Next Stars Drafted Directly to the NBA
| Player | Draft Year | Pick | NBL Team | NBA Team |
|---|---|---|---|---|
| LaMelo Ball | 2020 | 3rd | Illawarra Hawks | Charlotte Hornets |
| RJ Hampton | 2020 | 24th | NZ Breakers | Milwaukee Bucks |
| Josh Giddey | 2021 | 6th | Adelaide 36ers | OKC Thunder |
| Ousmane Dieng | 2022 | 11th | NZ Breakers | OKC Thunder |
| Rayan Rupert | 2023 | 43rd | NZ Breakers | Portland Trail Blazers |
| Alex Sarr | 2024 | 2nd | Perth Wildcats | Washington Wizards |
| AJ Johnson | 2024 | 23rd | NZ Breakers | Milwaukee Bucks |
| Bobi Klintman | 2024 | 37th | Brisbane Bullets | Dallas Mavericks |
| Ariel Hukporti | 2024 | 58th | NZ Breakers | New York Knicks |
Nine players drafted directly from NBL to NBA, including three lottery picks and one top-2 selection. The NBL’s Next Stars program — launched in 2018 — has become a legitimate alternative to NCAA basketball for NBA-bound prospects.
LaMelo Ball wasn’t viewed as a top-five prospect when he arrived at the Illawarra Hawks. Josh Giddey wasn’t projected in the top 10. The NBL environment — playing against grown professionals in a physical league — elevated their draft stock in ways that college basketball couldn’t.
Australian NBL Alumni Currently in the NBA
Beyond Next Stars, a steady stream of Australian talent flows from NBL development into NBA careers: Patty Mills, Joe Ingles, Dante Exum, Josh Giddey, Dyson Daniels, and others all either played in or came through the NBL system.
Where the NBL Sits Globally
To understand the NBA-NBL spread, it helps to place the NBL in the global basketball talent hierarchy:
| Tier | Leagues | Relation to NBA |
|---|---|---|
| Tier 0 | NBA | The standard |
| Tier 1 | EuroLeague, Spanish ACB | Best NBA teams by 15-20; competitive with NBA bottom-feeders |
| Tier 2 | NBL Australia, Turkish BSL, Italian Lega A, NBA G League, French Pro A | NBA by 20-30 on average |
| Tier 3 | Greek Basket League, German BBL, Chinese CBA | NBA by 30-40 |
| Tier 4 | Most other national leagues | NBA by 40+ |
The NBL’s position in Tier 2 is well-supported by cross-league player movement. NBL imports frequently have G League or lower European league backgrounds. The top NBL team in any given year is roughly equivalent to a strong G League squad — competitive with NBA fringe players, but missing the elite talent that separates NBA rotation players from everyone else.
What This Means for Betting and Prediction Markets
Preseason Spread Calibration
When NBLxNBA games do get lines, the market has settled on roughly these numbers:
- NBA -15 to -20 for competitive NBL teams (Melbourne United, Perth Wildcats)
- NBA -20 to -30 for mid-table or weaker NBL sides
- Over/under around 200-210, reflecting the NBA team’s scoring pace vs. the NBL team’s defensive limitations
The 2025 Melbourne Series showed this in action: Melbourne United (one of the NBL’s strongest sides) got a +20 spread and covered. South East Melbourne Phoenix (mid-pack) got +25 and didn’t cover.
Using NBL Data to Project NBA Rookie Performance
For builders working with sports betting APIs and autonomous betting agents, the NBL is an undervalued data source for projecting NBA rookie performance:
- NBL Next Stars stats translate to the NBA at a measurable discount rate
- LaMelo Ball averaged 17/7.4/6.8 in the NBL and 15.7/5.9/6.1 as an NBA rookie — roughly 85-90% translation on counting stats
- Josh Giddey averaged 10.9/7.4/7.6 in the NBL and 12.5/7.8/6.4 as an NBA rookie — similar translation rate on rebounds and assists, with a scoring bump from increased NBA pace
This creates an edge for anyone building models that incorporate international league data into NBA projections. Most retail sportsbooks don’t weight NBL performance data properly because the league is small and unfamiliar to American bettors.
Agent Infrastructure Angle
If you’re building prediction market bots or sharp betting systems, the NBA-NBL talent gap creates exploitable inefficiencies:
- NBLxNBA preseason lines are thin-market, low-liquidity bets where models outperform the public. An agent with historical NBLxNBA data and current roster strength metrics can find value.
- NBA rookie over/under props can be sharpened by incorporating NBL performance data that most models ignore.
- NBL domestic betting markets (available through Australian sportsbooks and some offshore books) are softer than NBA markets, with less sharp money and weaker closing lines.
For autonomous agents operating through the agent betting stack — using agentic wallets for fund management and trading APIs for execution — the NBL represents a high-edge, low-competition market.
The 8-Minute Problem
One often-overlooked factor in NBA vs. NBL comparisons: NBL games are 40 minutes long (four 10-minute quarters). NBA games are 48 minutes (four 12-minute quarters). This 20% difference in game length matters:
- NBL teams playing 48-minute NBA preseason games are in unfamiliar territory — fatigue sets in during the fourth quarter, which is when NBA teams traditionally pull away
- In the 2025 Melbourne Series, both NBL teams faded in the fourth quarter against the Pelicans, particularly South East Melbourne, who were limited to 37 second-half points
- Scoring pace adjustments need to account for this: an NBL team averaging 90 points per 40-minute game is actually producing at a ~108 per-48 pace, which is competitive with lower-end NBA teams
If NBLxNBA games were played on 40-minute clocks, the point spread would narrow by an estimated 3-5 points.
Bottom Line
The NBA-NBL talent gap is real, structural, and primarily driven by a ~100:1 salary differential. The typical point spread is 15-25 points, with the exact number depending on NBA lineup intensity and the specific NBL team. The NBL’s real value isn’t in competing head-to-head with the NBA — it’s as a development league, a betting market with exploitable inefficiencies, and a data source that most models underweight.
For anyone building autonomous betting agents or prediction market systems: the NBL is one of the most undervalued leagues in global basketball from an informational edge perspective. The talent gap is wide, but the data gap — between what’s available and what’s priced in — is even wider.
What’s Next
- NBA vs NBL Betting Guide — Sportsbooks, bet types, odds formats, vig comparison, and NBL betting strategies
- Agent Betting Stack Overview — The four-layer framework for building autonomous betting agents
- Prediction Market API Reference — API documentation for Polymarket, Kalshi, and sportsbook integrations
- Sportsbook API Integration Guides — Connect your agents to live odds feeds
- Sharp Betting Strategies — Advanced techniques for finding value in sports markets
- AgentBets Vig Index — Daily-updated sportsbook efficiency rankings